Driving Value:
The Long and Short of It.
Your success is all about discovering trade ideas and exploiting them.
Finding these ideas is your highest-value task.
InvestIn is your comprehensive digital research assistant to surface ideas unknown to you. Doing so is InvestIn’s highest-value benefit.
Ideas through Every Door.
You know your strategy. You know how to execute.
Discovering trading ideas begins your value-creation process.
Maybe long positions. Maybe shorts.
INVESTIN IS AN IDEA ENGINE.
What You Need
A single ratio or quantitative statistic is nearly useless in identifying a high-profit trading idea.
Besides, that’s not how you think. You’re considering multiple factors at once and across many time periods searching for the intersection of results and your fund’s unique buying criteria.
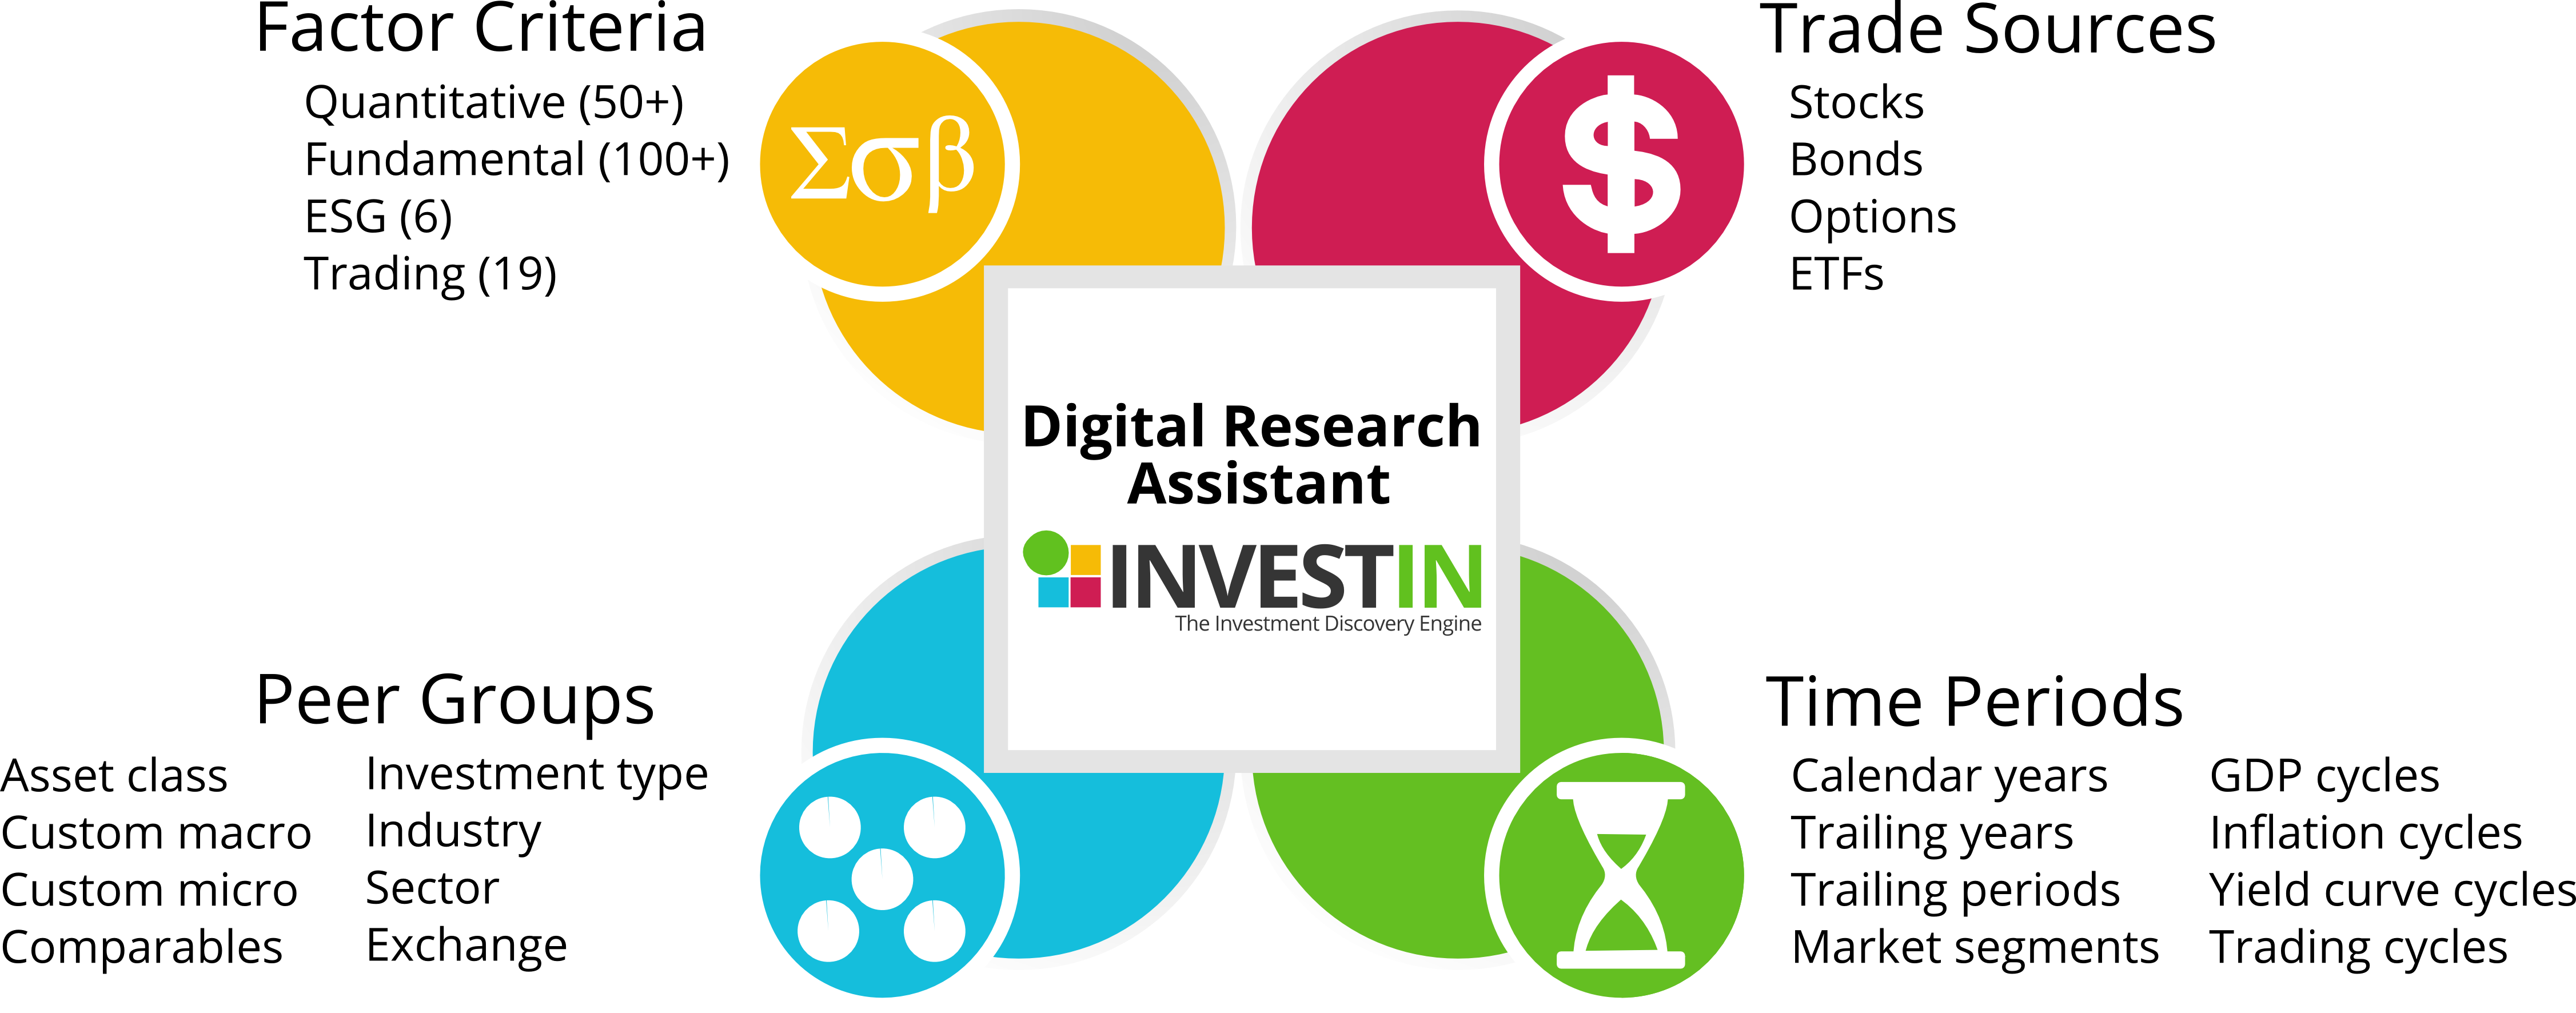
Now, in one place, you have the complete roster of quantitative statistics, fundamental financials, and time periods for discovering wholly objective targets that supplement sourcing from your internal methods.
Productivity
No other tool puts multi-factor, multi-time period, algorithmic fitting at your finger tips like InvestIn.
Instead of spending talent and resources plowing through factors one at a time and dumping them into spreadsheets, InvestIn surfaces them for you in seconds.
An advanced genetic algorithm orders your factor and time period assemblies from best-to-worst fit (i.e. aligning to long and short trades), and this focuses your attention on strategy fit and profit potential.
Fundamental Factors
- Altman Z-score
- Cashflow Margin
- Cash Per Employee
- Cash Return On Invested Capital
- Cashflow Growth
- Current Debt/Equity
- Current Ratio
- Debt/Equity
- Dividend Yield
- EBIT Margin
- EBIT Yield
- EBITDA to Enterprise Value
- Enterprise Value
- Enterprise Value Change
- Enterprise Yield
- EPS Growth
- EPS Surprise Percent
- ESG – Corporate Governance
- ESG – Environmental
- ESG – Social
- ESG Controversies Score
- ESG Score
- Float Ratio
- Free Cashflow
- Free Cashflow Growth
- Free Cashflow to equity
- Free Cashflow to Sales
- Free Cashflow to Equity Yield
- Free Cashflow Yield
- Greenblatt Magic Formula
- Greenblatt Return on Invested Capital
- Gross Profit
- Gross Profit Margin
- Gross Profit to Total Assets
- Gross Profit Yield
- High Price/Book
- High Price/Earnings to Growth Ratio
- High Price/Equity
- High Price/Sales
- Insider Percent
- Institution Percent
- Interest Coverage Ratio
- Long Term Debt/Equity
- Low Price/Earnings to Growth Ratio
- Low Price/Book
- Low Price/Equity
- Low Price/Sales
- Market Cap
- Net Cash Value Per Share
- Net Current Asset Value Per Share
- Net Fixed assets
- Net Income
- Net Profit Margin
- Net Profit Per Employee
- Net Profit Yield
- Net To Operating Profit
- Net-Net Working Capital Per Share
- Operating Income Growth
- Operating income Yield
- Operating Margin
- Operating To Gross Profit
- Piotroski Score
- Price to Net Cash Value
- Price to Net Current Asset Value
- Price to Net-Net Working Capital
- Return on Assets
- Return on Equity
- Return on Invested Capital
- Revenue Growth
- Revenue Per Employee
- Revenue to Enterprise Value
- Short Ratio
- Short Term Cash Power
- Total Cash
- Total Debt Cash Coverage
- Total Debts/Total Assets
Quantitative Factors
- Active Premium
- Alpha
- Annualized CAGR
- Annualized Return
- Annualized SD
- Average Gain
- Average Loss
- Average Rank
- Average Return
- Beta
- Calmar Ratio
- Correlation Coefficient
- Down Capture
- Down Number Ratio
- Down Percentage Ratio
- Downside Deviation
- Expected Tail Return 95%
- Expected Tail Return 99%
- Expected Tail Risk 95%
- Expected Tail Risk 99%
- Fat Tailed VaR 95%
- Fat Tailed VaR 99%
- Gain To Loss Ratio
- Information Ratio
- Jensen Alpha
- Kurtosis
- Max Drawdown
- Modified VaR 95%
- Modified VaR 99%
- Percent Gain
- Potential Gain 5%
- Profit To Loss Ratio
- Rachev Ratio
- R-Squared
- Semi Deviation
- Sharpe Ratio
- Skewness
- Sortino Ratio
- Standard Deviation
- Standard Error
- STARR Ratio
- Sterling Ratio
- Tracking Error
- Treynor Ratio
- T-Stat
- Up Capture
- Up Number Ratio
- Up Percentage Ratio
- VaR 95%
- VaR 99%
Time Periods
- 1-Year
- 2-Years
- 3-Years
- 5-Years
- 7-Years
- 10-Years
- 15-Years
- 20-Years
- Calendar Year 1-Year Ago
- Calendar Year 2-Years Ago
- Calendar Year 3-Years Ago
- Calendar Year 4-Years Ago
- Calendar Year 5-Years Ago
- Calendar Year 6-Years Ago
- Calendar Year 7-Years Ago
- Calendar Year 8-Years Ago
- Calendar Year 9-Years Ago
- Calendar Year 10-Years Ago
- Year 2008
- Bull Mar 2009 – Dec 2017
- Bull Oct 2002 – Oct 2007
- Bear Correction Mar 2000 – Aug 2000
- Bear CorrectionOct 2001 – Dec 2001
- Bear Nov 2007 – Feb 2009
- Bear Sep 2000 – Sep 2002
- Minor Bear May 2011 – Sep 2011
- Bull Correction Dec 2002 – Feb 2003
- Sideways Jan 2011 – Dec 2011
- Sideways Apr 2015 – Mar 2016
- Rising Yield Curve Jan 2001 – Aug 2001 (Pos Momentum)
- Steep Yield Curve Sep 2001 – Jul 2003 (Pos Momentum)
- Steep Yield Curve Aug 2003 – Sep 2004 (Neg Momentum)
- Rising Yield Curve Oct 2004 – Apr 2005 (Neg Momentum)
- Flat Yield Curve May 2005 – Jul 2006 (Neg Momentum)
- Inverted Yield Curve Aug 2006 – Feb 2007
- Flat Yield Curve Mar 2007 – Aug 2007 (Pos Momentum)
- Steep Yield Curve Sep 2007 – Jun 2011 (Pos Momentum)
- Steep Yield Curve Jul 2011 – Apr 2012 (Neg Momentum)
- Rising Yield Curve May 2012 – Nov 2012 (Pos Momentum)
- Steep Yield Curve Dec 2012 – Dec 2013 (Pos Momentum)
- Steep Yield Curve Jan 2014 – Jul 2015 (Neg Momentum)
- Rising Yield Curve Aug 2015 – Feb 2018 (Neg Momentum)
- Flat Yield Curve Mar 2018 – Sep 2018 (Neg Momentum)
- Increasing GDP Growth Jan 2001 – Dec 2004
- Decreasing GDP Growth Jan 2005 – Dec 2009
- Sideways GDP Growth Jan 2010 – Dec 2017
- Sideways GDP Growth Jan 2010 – Dec 2012
- Increasing GDP Growth Jan 2013 – Dec 2015
- Increasing GDP Growth Jan2016 – Sep 2018
- Decreasing Unemployment Jan 2001 – Dec 2006
- Increasing Unemployment Jan 2007 – Dec 2009
- Decreasing Unemployment Jan 2010 – Sep 2018
- Increasing Average Inflation Jan 2001 – Dec 2007
- Decreasing Average Inflation Jan 2008 – Dec 2015
- Sideways Average Inflation Jan 2016 – Sep 2018
- Decreasing Average Inflation Jan 2007 – Dec 2010
- Increasing Average Inflation Jan 2011 – Dec 2015
- Increasing Average Inflation Jan 2016 – Sep 2018
- 0-Years Outlook
- 1-Year Outlook
- 2-Years Outlook
- 3-Years Outlook
- 4-Years Outlook
- 5-Years Outlook
- 6-Years Outlook
- 7-Years Outlook
- 8-Years Outlook
- 9-Years Outlook
- 10-Years Outlook
- Since Inception
- Most Recent
- 3-Months
- 6-Months
- Year-To-Date
- 12 Trailing Months
- Past 2 Quarters
- Past 3 Quarters
BIG DATA. BIG IDEAS.
Each stock in InvestIn’s database is ranked for every quantitative and fundamental factor across every time period. This is over 7,000 rankings per stock.
Then, consider InvestIn’s multi-factor, multi-period algorithmic power that processes everything simultaneously and gives you results in just seconds.
There’s no need for you to dump results into a spreadsheet for each metric and repeat and repeat. You see the results immediately with the best ideas listed first.

An Idea Well Earned.
The set of examples below illustrate InvestIn’s power to produce results aligned with the quantitative and fundamental factors – as well as a broad array of market and economic historical segments – most important to you.
Think about all this capability for an annual $6,000 subscription.
Strong results at a low cost. InvestIn is a trade worth making.
OK, BUT SHOW ME.
QUANTAMENTAL FACTOR EXAMPLE (LONG)
Select any number of quant and fundamental factors and any number of time periods. Your expertise is facilitated with InvestIn’s flexibility in defining how you set the selection boundaries.
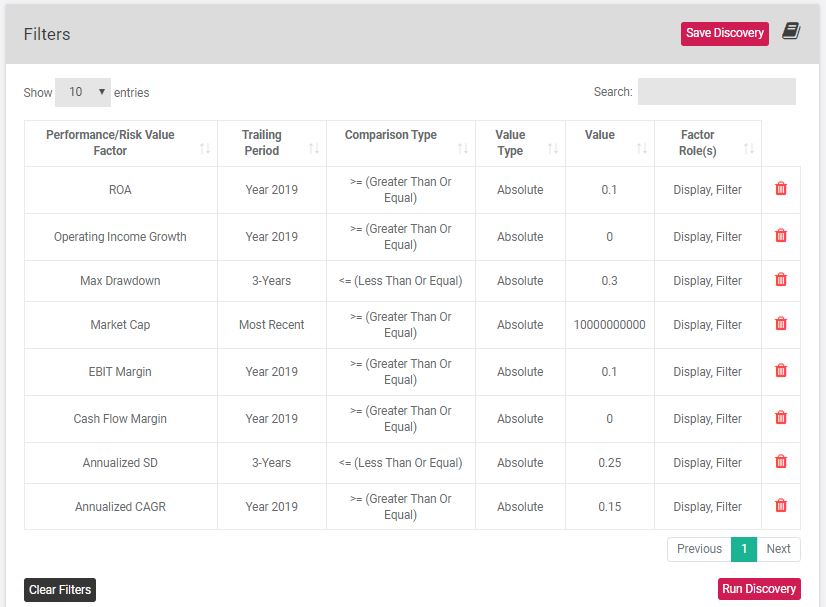
The portfolio on this live page was created using returns up to January 2020 (i.e. prior to the Covid19 market decline); the results for all subsequent months are active and include monthly rebalancing. Functions are limited for this public access.
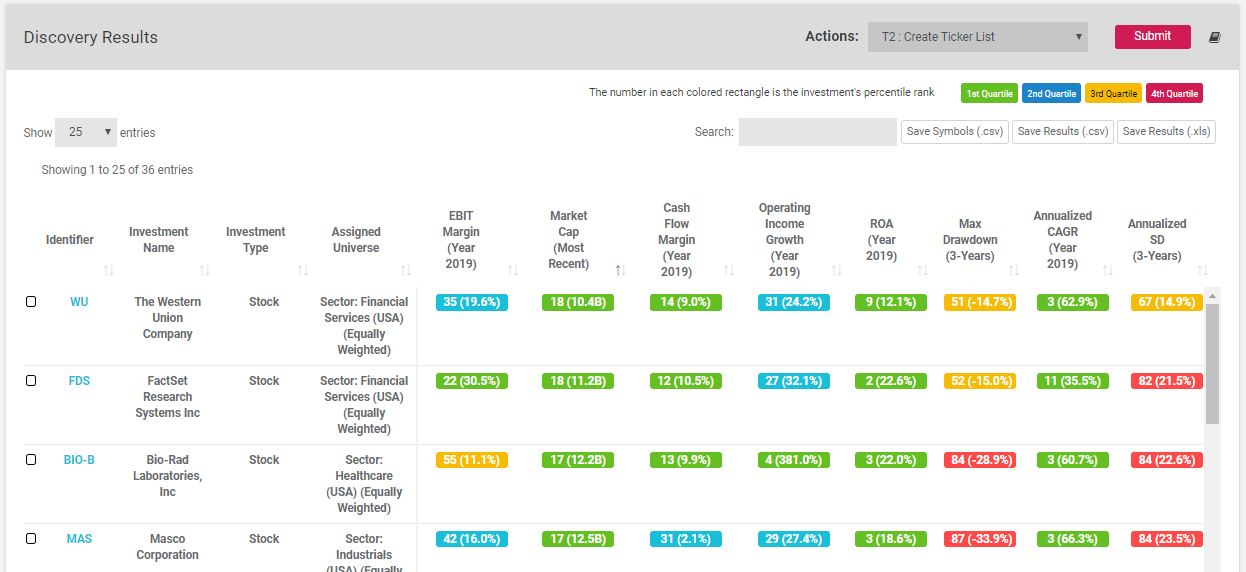
There are 36 stocks that meet the criteria of this particular example and they’re ordered from 1 to 36 in the results table. This focused list, produced in a few seconds, is ready for your analysis. And, there’s a number of powerful functions to speed you along to an investment decision. InvestIn proves its value as a primary idea resource.
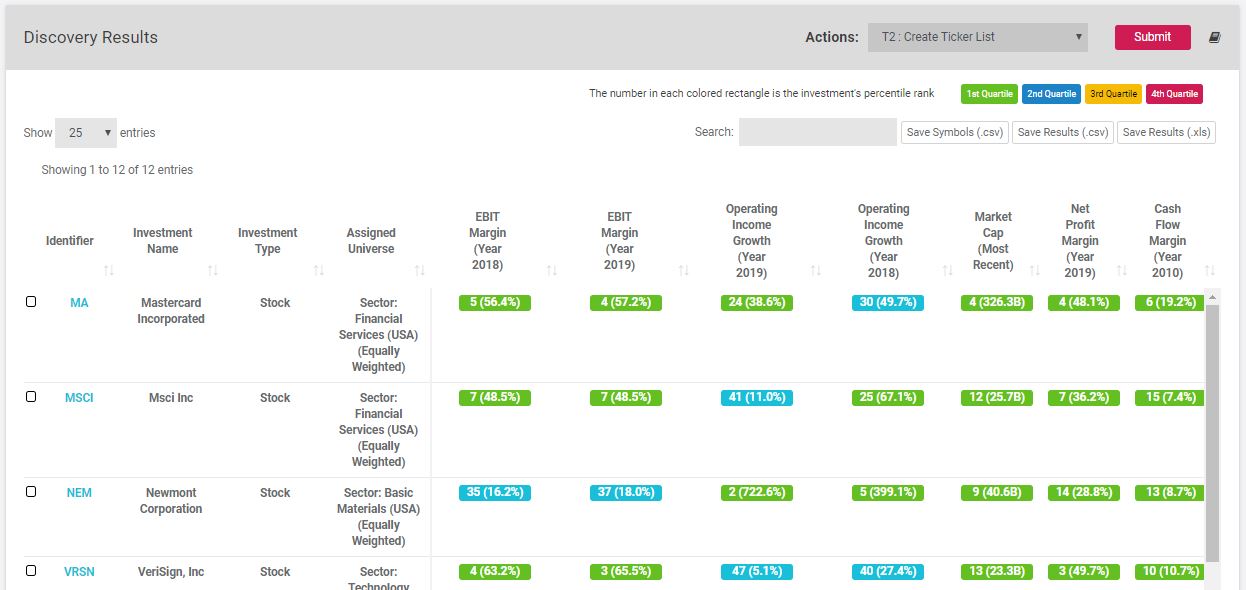
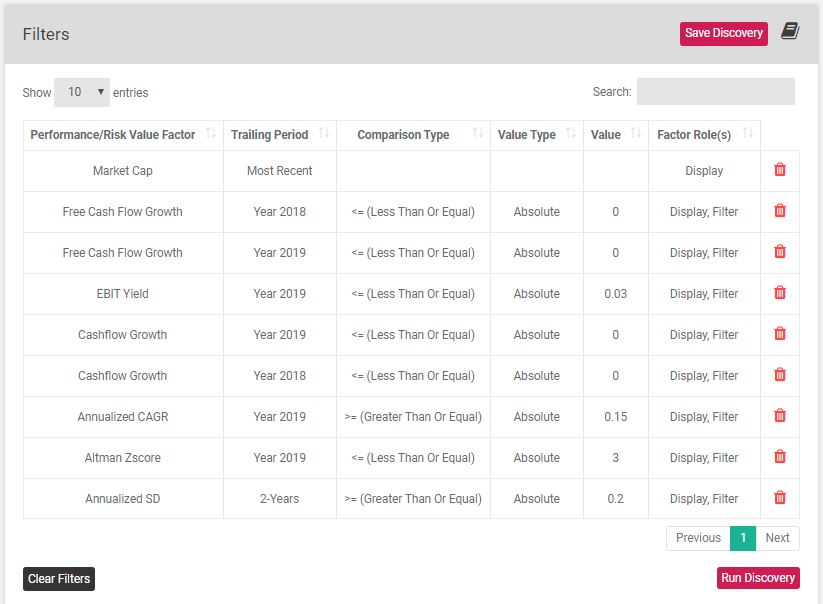
MULTI-FUNDAMENTAL FACTOR EXAMPLE (LONG)
InvestIn lets you assemble ideas in one place and experiment to see what mix of factors best captures your trading instincts. For this R&D, it’s easy to set up your tests with in-sample periods and then show your out-of-sample results – the “walking forward” period – in the same table (i.e. using factors selected for display only).
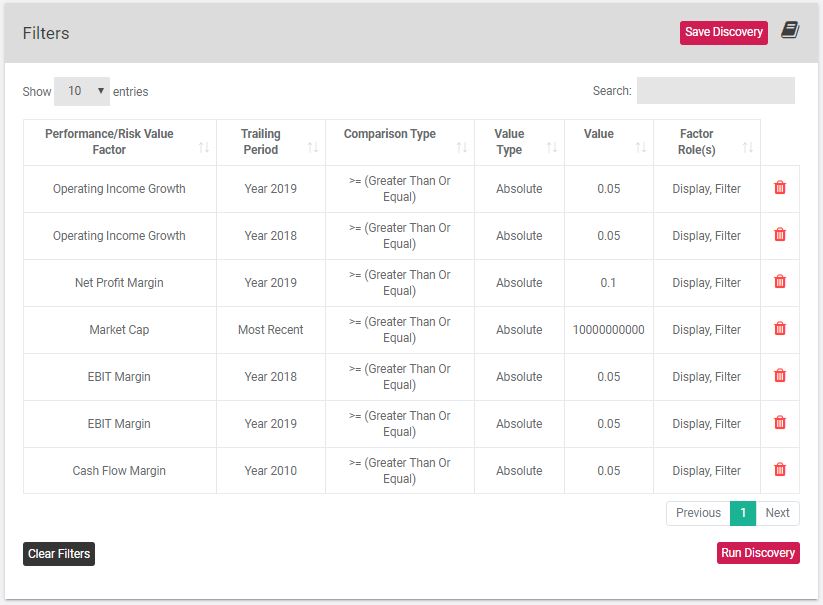
The portfolio on this live page was created using returns up to January 2020 (i.e. prior to the Covid19 market decline); the results for all subsequent months are active and include monthly rebalancing. Functions are limited for this public access.
You have over 100 fundamental ratios available across almost 80 different time periods; you can choose the most recent period or set a series of years to spot trends. It’s easy to run iterations to refine your thinking. Once you tune an idea-discovery set, one button saves it for future use.
MULTI-QUANT FACTOR EXAMPLE (LONG)
This example includes only selected quant factors. You can choose whatever factors and time periods you prefer. Instead of numerics, you can also set your discovery to ranking segments: quartile, quintile, decile, or percentile.
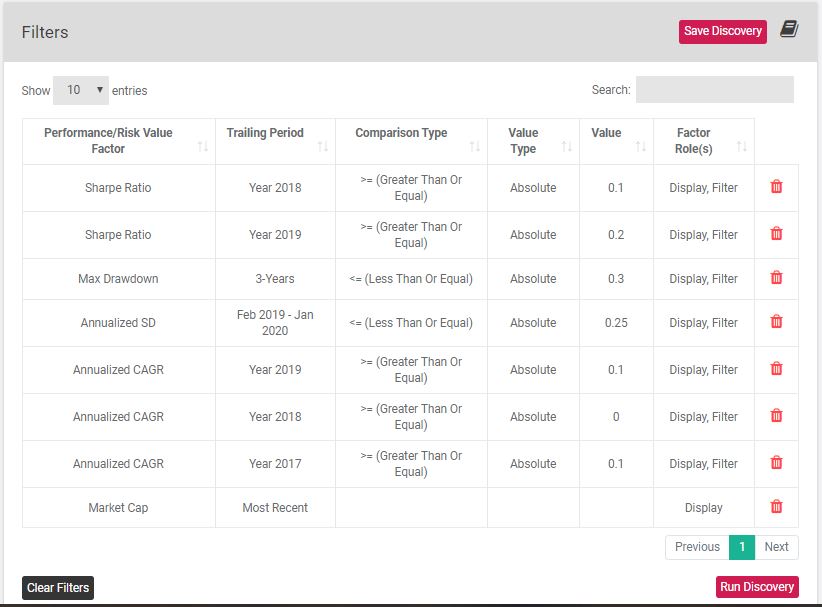
The portfolio on this live page was created using returns up to January 2020 (i.e. prior to the Covid19 market decline); the results for all subsequent months are active and include monthly rebalancing. Functions are limited for this public access.
There are 45 stocks that meet these criteria, and they’re ordered from 1 to 45 in the results table. Start from the top – representing the best ideas – and you have a map for allocating time and resources for digging deeper into these for strategic fit and valuation.
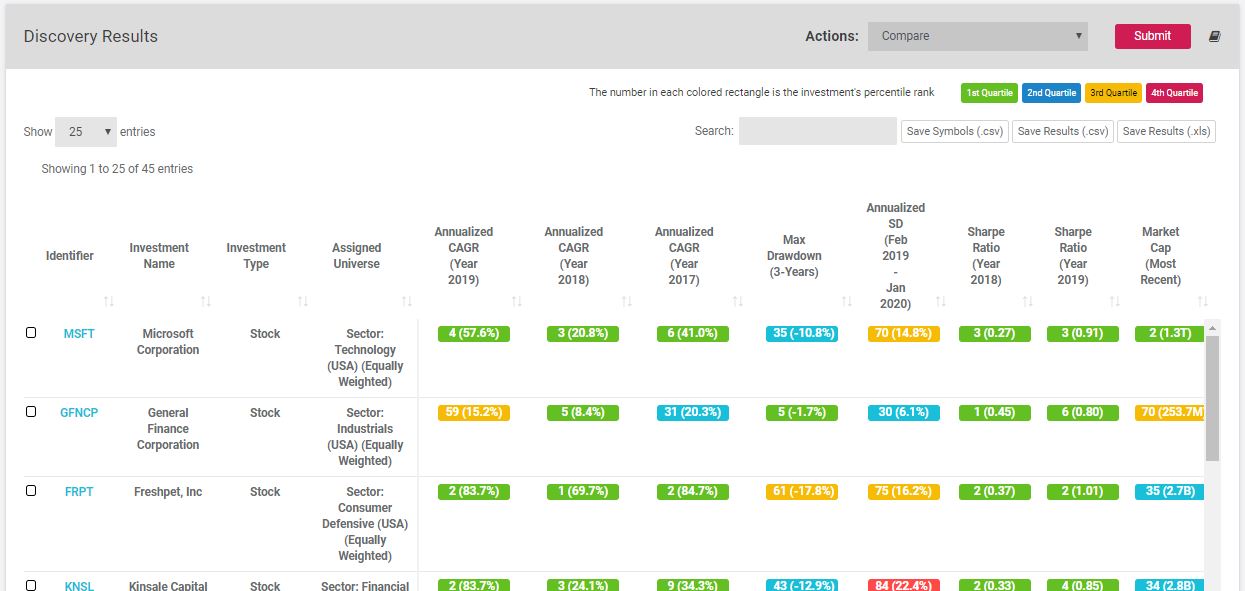
IDEA ALLOCATOR – OPTIMIZE THE BEST LONG IDEAS
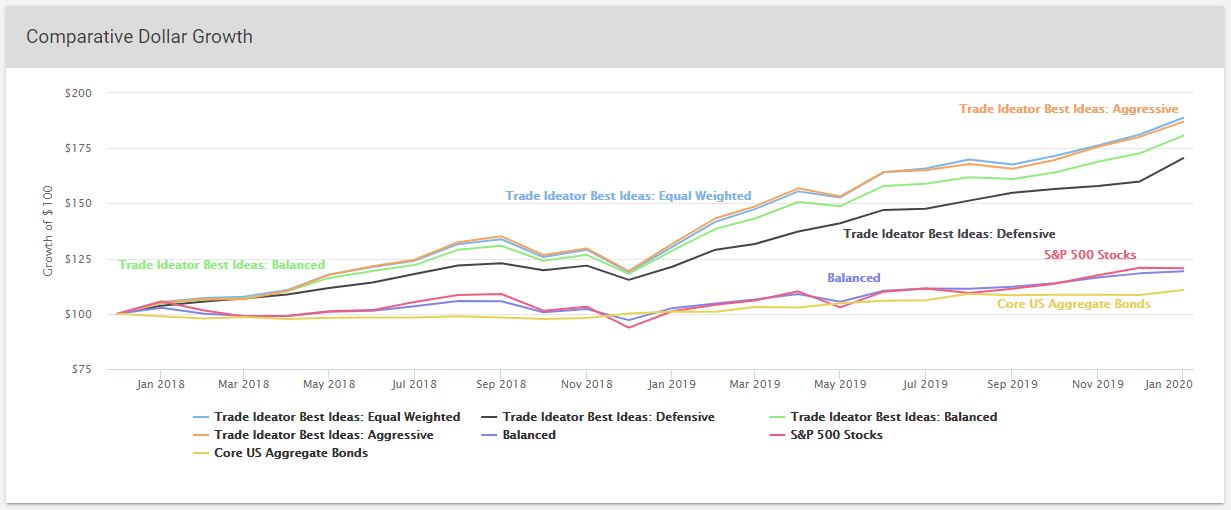
InvestIn supports your creativity, instincts, and trend-spotting. For the examples above, there’s a number of ways to discover ideas. Here, we’ve assembled the best 5 ideas from each of the 3 long-only results tables into a single target list of 15 stocks.
The portfolio on this live page was created using returns up to January 2020 (i.e. prior to the Covid19 market decline); the results for all subsequent months are active and include monthly rebalancing. Functions are limited for this public access.
With your best ideas in a single frame, InvestIn’s industry-leading genetic algorithm optimizes these ideas to a particular tilt you define, say, defensive, aggressive, and balanced. (Of course, you have full freedom to build any number of these sentiment models).
For example, using the same 15 best long ideas (click the button for the live page), a defensive tilt has 49% less volatility and 90% less max drawdown than aggressive but aggressive has 29% more return. You don’t compromise on your trade selections but you create different tailored investment experiences . . . all in just seconds.
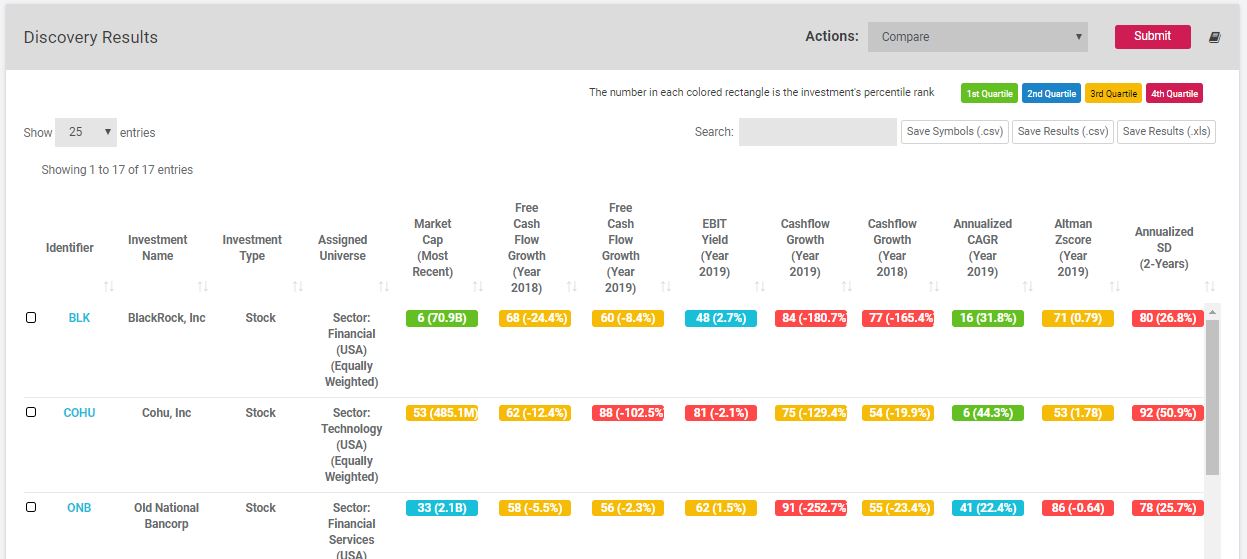
QUANTAMENTAL FACTOR EXAMPLE (SHORT)
Your discovery sets filter InvestIn’s database to your preferences and then present the results ordered from best to worst. Long-only discoveries seek the best; short-only seeks the worst. The beauty of InvestIn is the whole process works the same, but for shorting ideas you focus on the worst performers.
The portfolio on this live page was created using returns up to January 2020 (i.e. prior to the Covid19 market decline); the results for all subsequent months are active and include monthly rebalancing. Functions are limited for this public access.
The color coding – green rectangles are the top 25% in the factor; red are the bottom 25% – notifies you immediately how a stock ranks to InvestIn’s universe of over 50,000 investments. You can see these results show performance in the bottom half of the actionable factors for shorting candidates.
Resources on Resources.
InvestIn’s standard subscription is an entire toolkit comprised of investment selection, portfolio building, and advanced optimization tools. In your role as research analyst or PM, you emphasize InvestIn’s trade-idea generation. But, there remain many other valuable tools you’ll find beneficial in the package.
Full stock, ETF, and options coverage
Optional HF subscription
Over 50 investment metrics
Over 100 financial and ratio metrics
Advanced ranking system for every metric
Advanced stock investment analysis
Standard industry and sector peer groups
Customize peer groups to any metric
Multi-period stock positioning to any metric
Scenario testing to market or economic segments
Custom peer group benchmarks
Genetic algorithm for allocating trade ideas
Multi-factor, multi-period optimization
Save trading groups as investable themes
Easy export of any table or graph
Cloud-based for anywhere/anytime usage
Easy to use with a top-end design
No minimum users for the base subscription
Valuing a Discovered Idea.
In receiving InvestIn’s results from your discovery definitions, trade ideas emerge. Sure, some names are familiar to you but others are not. Each name new to you represents substantial value on two fronts.
First, InvestIn is revealed as a resource you can trust in sourcing trade ideas aligned with your strategy.
Second, each new InvestIn trade idea flowing through your decision-making process into an actual investment is pure financial value because you would have been less likely to discover this idea prior to InvestIn. And, as we noted above, trade idea generation is your highest-value task.
Separate or together, these two fronts produce benefits far exceeding InvestIn’s $6,000 per user annual cost.
InvestIn: minimal cost risk and substantial upside . . . dimensions any asset manager will love.
1 - 5 Users
(No discount)
$500
/user/month
(Optional hedge fund directory is an additional $6,000)
6 - 10 Users
(15% discount)
$425
/user/month
(Hedge fund directory is included)
10+ Users
(25% discount)
$375
/user/month
(Hedge fund directory is included)