Speak Their Language, and They’ll Listen
IR Persuasion Confronts
Analysts’ Resistance.
Investor Relations (IR) departments market a company’s stock to a marketplace of buy-side and sell-side analysts.
As an IR pro, you sell your company’s positives and try to neutralize its negatives.
Analysts are trained to be skeptics . . . to look for what’s wrong. They’re oriented first to say “I don’t believe it.”
This isn’t simply about being difficult, but analysts come to valuing your company’s stock’s current and go-forward valuation from their own research (and biases too). They’re informed.
Or, are they?
Your challenge is to change analysts’ attitudes and perceptions, if negative, and to keep them, if positive.
An IR department’s “our story” presentation is a starting point but, most often, it isn’t framed in the language analysts best understand – the financial (sell-side) and investment (buy-side) story.
The undercurrent – spoken or unspoken – is always, “I need more than this.”

Expert-level ability to communicate effectively with the investment community
A “Must Have” skill as advocated by the NIRI Think Tank in its 2019 report, Investor Relations: The Disruption Opportunity
InvestIn is an arsenal (“the Arsenal”) of valuable financial- and investor-oriented tools enabling Investor Relations pros to speak in common analytical language with both sell- and buy-side analysts.
Really? All This for $6,000?
You may be using Bloomberg, Capital IQ, Factset, or Refinitiv for data about your company’s stock. Or, maybe you’re just using free tools on the Internet.
In one place, with the best value by far, is the Arsenal’s breadth of investment and financial data in one platform. But, that’s just data.
It’s what you’re able to do with this data that sets the Arsenal apart: customized macro and micro peer groups; comparables from any mix of investment and financial metrics; scenario testing to various market and economic segments.
Great design? Done. Easy to use? Done. Anywhere/Anytime? Done.
Easiest on your IR department’s budget. Done.
Over 50 investment metrics
Over 100 financial and ratio metrics
Rankings from best to worst for every metric
Advanced stock investment analysis
Standard industry and sector peer groups
Customize peer groups to any metric
Multi-period stock positioning to any metric
Scenario testing to market or economic segments
Custom peer group benchmarks
Comparables to any mix of criteria
Comparables saved as groupings
Easy export of any table or graph
Cloud-based for anywhere/anytime usage
Easy to use with a top-end design
$6,000 per user per year (and no minimum users)

Healthy Paranoia
The art of objection handling is anticipation.
Healthy paranoia leads the IR pro to take an inventory of all known and possible objections that can be made against the “our story” presentation.
Ready answers are prepared from the analysts’ perspective: in their analytical language with the metrics important to them.
In this place, your IR department’s credibility increases and agenda control is advanced.
We say an IR pro’s highest achievement occurs when an analyst gains an insight previously unknown or has an objection reframed from a negative to a positive.
Now, confidence reigns when objections come.
ANALYSIS. PEER GROUPS. COMPARABLES.
See your stock through an analyst's eyes.
See all sides of both financial data and ratios (the sell-side view) but also investment metrics (the buy-side view).
When you know what analysts know – and maybe more – you control the valuation agenda.
The common IR method is to compare your stock to others in its industry and/or sector. This may fit with sell-side analysts, but the buy-side looks at stocks decoupled from such groupings.
The Arsenal shows you your stock’s quartile ranking across 50+ investment stats and over 100+ financial datapoints and ratios. And, it does so across historical time periods to show the trending direction.
Peer groups from macro to micro, standard or custom.
Sell-side analysts emphasize industry and sector peer groups. The Arsenal maps a comprehensive financial data and ratio inventory so you know what analysts know.
But, from that basic level, you can go beyond industry/sector peers to groups connected to specific data points. For example, a peer group of other stocks with a similar cashflow profile or debt structure.
Buy-side analysts look at a stock’s role in a portfolio irrespective of an industry or sector grouping. Here, it’s all about the investment measures: risk, return, and risk-adjusted return. Will your stock benefit a portfolio? With the Arsenal, you’ll have an informed answer.
Comparables for insightful positioning.
Your stock may be assigned to a single industry or sector, but, operationally, your company may cross over to a number of different business segments.
Broaden sell-side analysts’ understanding of your company’s financials to micro peer groups on any financial datapoint or ratio.
From an investor’s view (i.e. the buy-side), your stock must be considered with the universe of investment candidates (i.e. all stocks) according to specific risk and return factors.
These micro peer groups reveal relative performance unseen with other analytical tools.
The List of Investment Metrics Important to Buy-Side Analysts
- Active Premium
- Alpha
- Annualized CAGR
- Annualized Return
- Annualized SD
- Average Gain
- Average Loss
- Average Rank
- Average Return
- Beta
- Calmar Ratio
- Correlation Coefficient
- Down Capture
- Down Number Ratio
- Down Percentage Ratio
- Downside Deviation
- Expected Tail Return 95%
- Expected Tail Return 99%
- Expected Tail Risk 95%
- Expected Tail Risk 99%
- Fat Tailed VaR 95%
- Fat Tailed VaR 99%
- Gain To Loss Ratio
- Information Ratio
- Jensen Alpha
- Kurtosis
- Max Drawdown
- Modified VaR 95%
- Modified VaR 99%
- Percent Gain
- Potential Gain 5%
- Profit To Loss Ratio
- Rachev Ratio
- R-Squared
- Semi Deviation
- Sharpe Ratio
- Skewness
- Sortino Ratio
- Standard Deviation
- Standard Error
- STARR Ratio
- Sterling Ratio
- Tracking Error
- Treynor Ratio
- T-Stat
- Up Capture
- Up Number Ratio
- Up Percentage Ratio
- VaR 95%
- VaR 99%
The List of Financial Metrics Important to Sell-Side Analysts
- Altman Z-score
- Cashflow Margin
- Cash Per Employee
- Cash Return On Invested Capital
- Cashflow Growth
- Current Debt/Equity
- Current Ratio
- Debt/Equity
- Dividend Yield
- EBIT Margin
- EBIT Yield
- EBITDA to Enterprise Value
- Enterprise Value
- Enterprise Value Change
- Enterprise Yield
- EPS Growth
- EPS Surprise Percent
- ESG – Corporate Governance
- ESG – Environmental
- ESG – Social
- ESG Controversies Score
- ESG Score
- Float Ratio
- Free Cashflow
- Free Cashflow Growth
- Free Cashflow to equity
- Free Cashflow to Sales
- Free Cashflow to Equity Yield
- Free Cashflow Yield
- Greenblatt Magic Formula
- Greenblatt Return on Invested Capital
- Gross Profit
- Gross Profit Margin
- Gross Profit to Total Assets
- Gross Profit Yield
- High Price/Book
- High Price/Earnings to Growth Ratio
- High Price/Equity
- High Price/Sales
- Insider Percent
- Institution Percent
- Interest Coverage Ratio
- Long Term Debt/Equity
- Low Price/Earnings to Growth Ratio
- Low Price/Book
- Low Price/Equity
- Low Price/Sales
- Market Cap
- Net Cash Value Per Share
- Net Current Asset Value Per Share
- Net Fixed assets
- Net Income
- Net Profit Margin
- Net Profit Per Employee
- Net Profit Yield
- Net To Operating Profit
- Net-Net Working Capital Per Share
- Operating Income Growth
- Operating income Yield
- Operating Margin
- Operating To Gross Profit
- Piotroski Score
- Price to Net Cash Value
- Price to Net Current Asset Value
- Price to Net-Net Working Capital
- Return on Assets
- Return on Equity
- Return on Invested Capital
- Revenue Growth
- Revenue Per Employee
- Revenue to Enterprise Value
- Short Ratio
- Short Term Cash Power
- Total Cash
- Total Debt Cash Coverage
- Total Debts/Total Assets
OK, BUT SHOW ME.
Follow the Workflow Using Amazon (AMZN)
as an Example of the Arsenal’s Capabilities.
1
Amazon (AMZN):
Investment Profile
This page captures the scope of interest a buy-side analyst (or investor) considers: risk; return; risk-adjusted return.
Note at the top of the page the Arsenal’s exclusive average rank. Every investment in InvestIn’s vast database is ranked for each metric from the best to the worst. The “average rank” takes the average of all these metrics for both the investment peer group (the left chart) and the entire database (the right chart).
2
Amazon (AMZN):
Investment+Financial Ranks
This page shows the Arsenal’s depth in both investment measures, financial datapoints, and ratios.
Every metric is ranked from the best to the worst (the green bubble – the best – is the top 25%; the red – the worst – is in the bottom 75%).
On this single page, Amazon’s categorized investment and financial rankings are presented for a single, valuable reference.
3
Custom Peer Group:
Technology Services
Amazon’s sector assignment is Consumer Cyclicals. However, Amazon has many different business lines.
For example, let’s create another peer group for technology services companies indicative of Amazon Web Services (AWS) and related subsidiaries.
Saving this as an equal-weighted peer group, it now operates as a benchmark comparison.
4
Custom Peer Group:
Sharpe Ratio
We know from the investment profile that Amazon has a strong 3-year annualized Sharpe Ratio (a commonly used risk-adjusted measure; it identifies the amount of return per unit of investment risk).
Since Amazon’s reputation is a growth company, relative strength in the Sharpe Ratio shows its risk compensation.
Let’s create a peer group of stocks with a range above and below Amazon’s 3-year Sharpe Ratio.
5
Custom Peer Group:
Big Tech with a Twist
When analysts evaluate Big Tech – Apple; Amazon; Facebook; Alphabet; Microsoft – they do so with financial metrics such as valuation, revenue growth profit margin, and so forth. To be sure, these comparisons are easily done with the Arsenal (and for any custom grouping of stocks).
But, the investor’s view (buy-side) is an important dimension in positioning your stock for investment portfolios. With the Arsenal, you can take any custom peer group (in this example, Big Tech) and show both financial and investment benefits side by side.
6
Peer Group Comparison:
Sizing Up Amazon
The ability to quickly create any number of peer groups and save them as a proxy is a powerful tool for capturing relative investment and financial capabilities.
Since both buy-side and sell-side analysts look at relative excellence, positioning to custom peer groups brings to light specific investment and operational attributes the analysts likely did not consider.
If so, then you’ve given an insight and gathered more control over the agenda.
7
Relative Comparison:
Investment Metric
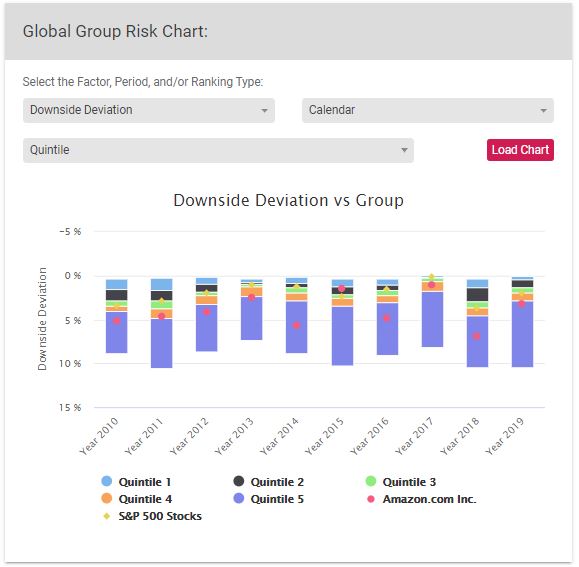
For any investment and financial metric, you can see an historical profile. You pick the metric, the time period for evaluation, and the segment ranks (i.e. quartile (25% segments); quintile (20% segments); decile (10% segments).
This provides a clear view of historical relative position for a specific measure. Here, Amazon is compared to all investments on Downside Deviation (i.e. volatility when the markets decline).
8
Relative Comparison:
Financial Metric
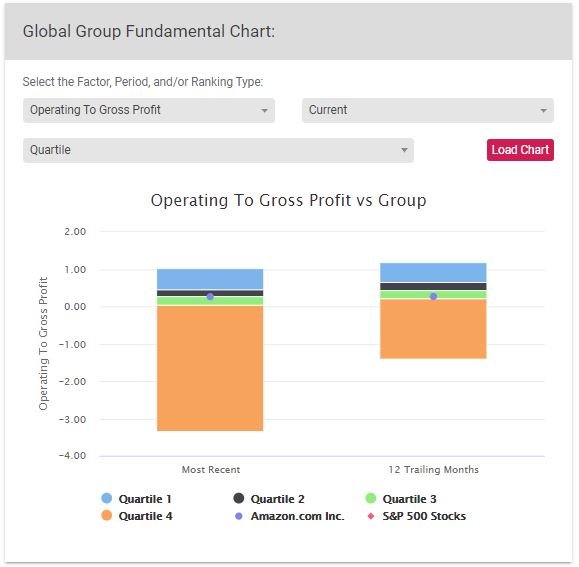
The Arsenal has over 100 different financial datapoints and ratios. This data warehouse is the sustenance for any analyst considering current and go-forward valuation.
The ability to identify, for your company’s stock, specific favorable measures to its peers is essential for combating biases and shallow thinking. You drive the discussion with your command of relative value.
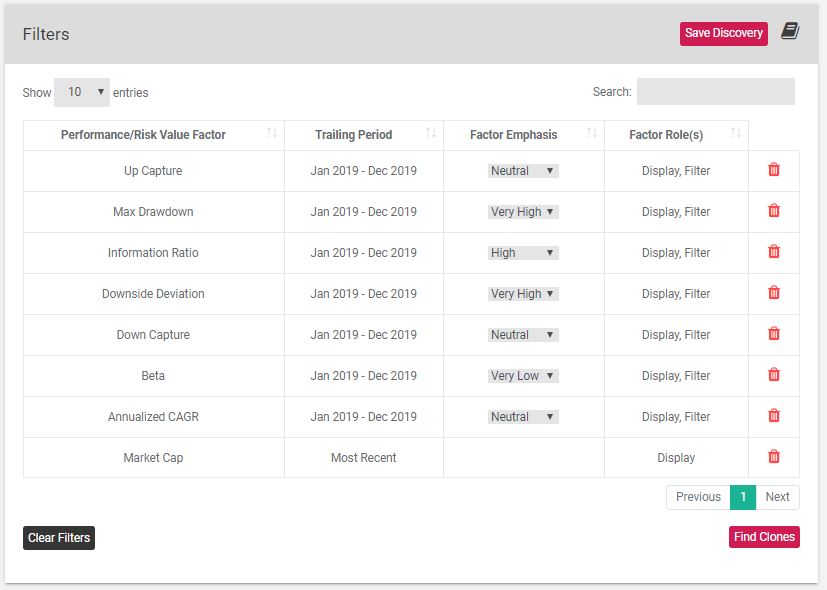
One of Your Core Tasks is Identifying Comparables
With the Arsenal, you set a comparable target (i.e. your company’s stock) and select any number of metrics to evaluate; this includes any number of time periods. And, if you want, you can weight one or more metrics for greater or lesser emphasis.
With the guidance in place, the Arsenal uses its powerful algorithms to find other stocks best-fitting your selected metrics.
Comparables can be set for all stocks or limited to your custom peer groups. From the resulting list, you can select any number for a side-by-side comparison.
You now have credible reference points for promoting a current and go-forward valuation most favorable to your company.
Your success in building the valuation case produces major justification for the essential role you play.
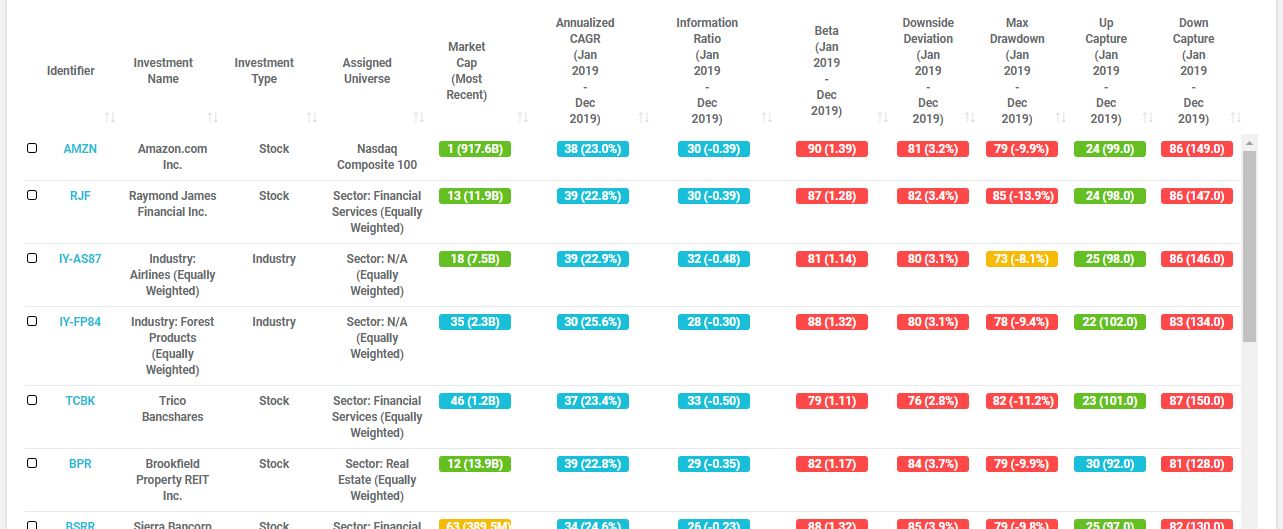
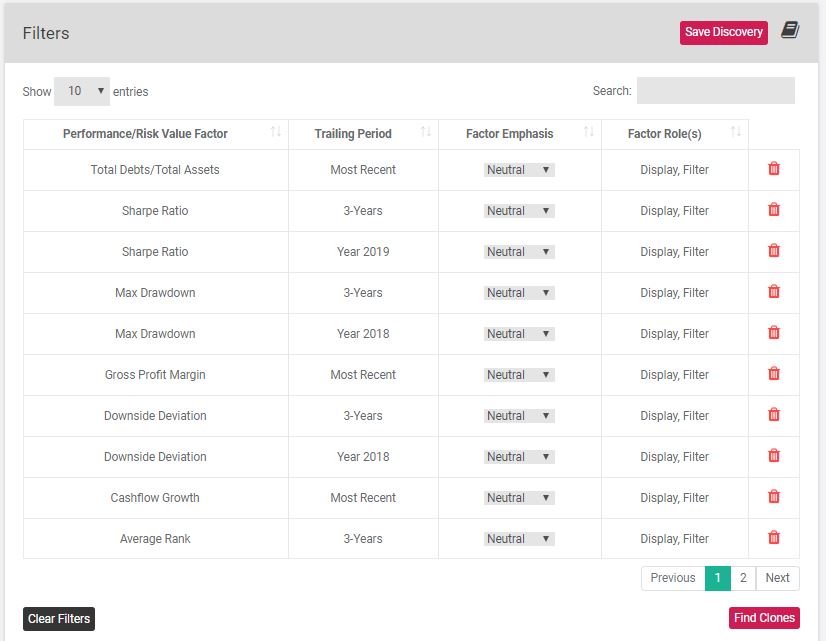
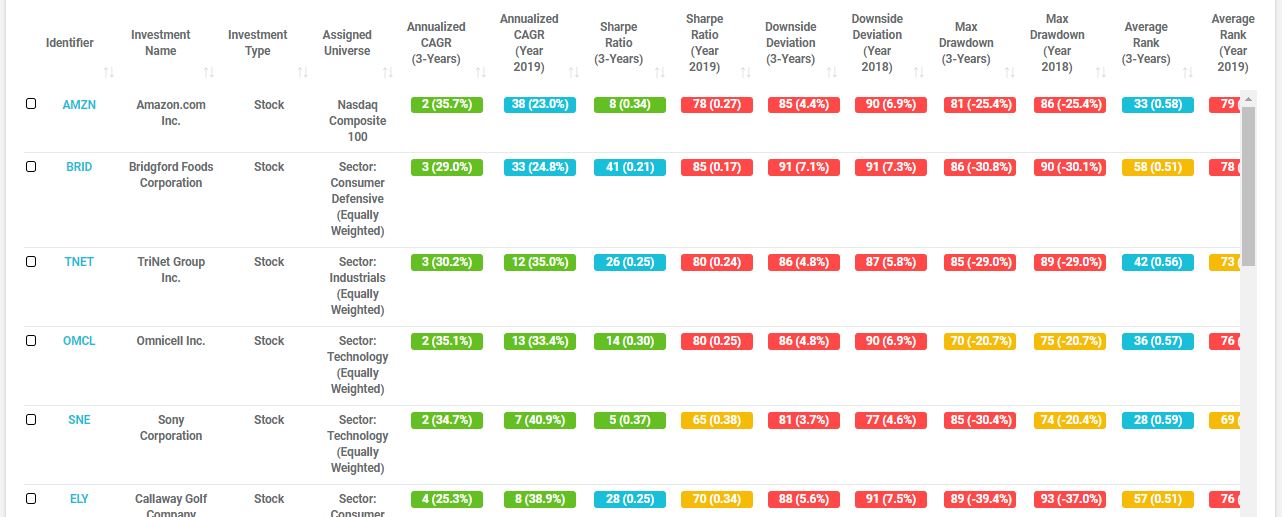
9
Comparables:
Investment-Only Metrics
With Amazon set as the comparable target, these metrics were selected to capture both return and risk dimensions, with the latter receiving greater emphasis in the algorithmic best-fitting process.
This is an excerpt from the results table showing comparbles best-fitting the selected investment metrics; the target (i.e. AMZN) is always on top.
10
Comparables:
Financial-Only Metrics
These financial metrics cover solvency, cashflow, and profitability. Any number of selections can be made and the Arsenal’s advanced algorithm always finds the best fit.
Selecting financial instead of investment metrics leads to a completely different comparable list.
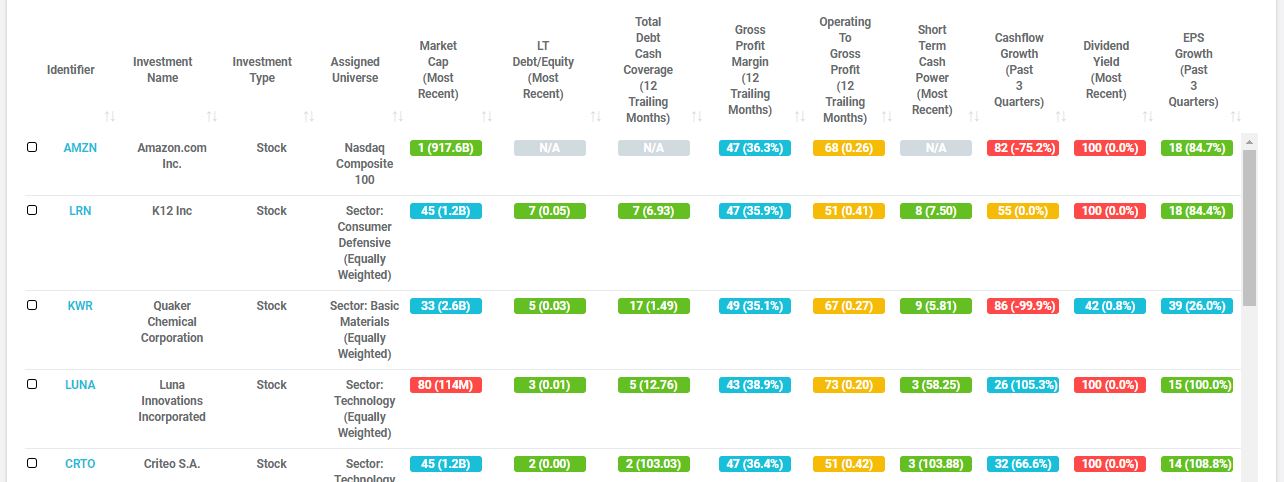
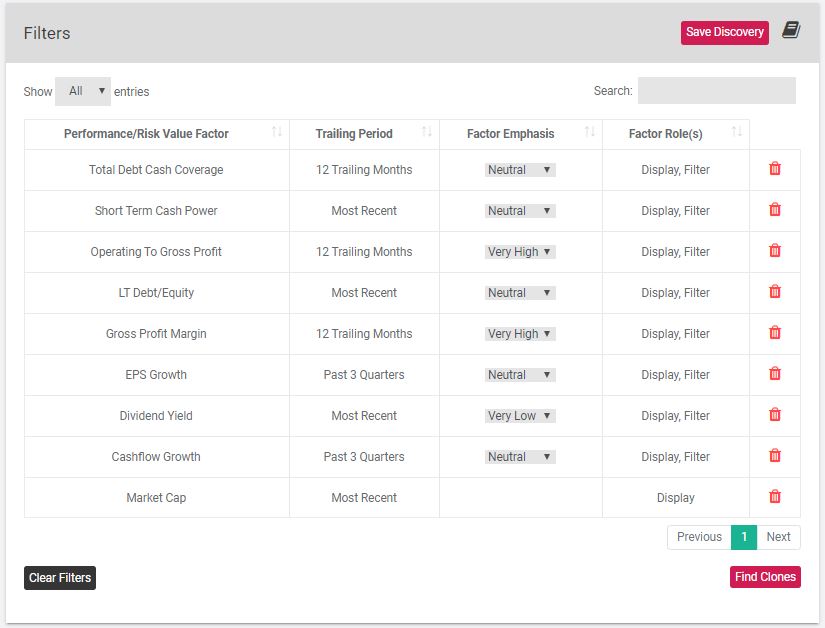
11
Comparables:
Mixed Metrics
A masters approach is to use a mix of investment and financial metrics. This is the truest approach to valuation since every company has both an investment story and a financial story operating together at all times.
And, again, the comparable table reveals a different set of companies. This reflects an investor’s highest desire: finding stocks with desired metrics. The Arsenal arms you with the ability to approach any investor’s preferences with intelligence.
Well-Armed and Ready.
The Arsenal arms you with credible evidence demonstrating a valuation methodology most favorable to your company’s stock. Boiled down, this is one of an IR department’s core purposes.
And, this battle is always on. During good times, you promote your stock’s positive trendline, particularly to the peer groups you define. During bad times, your evidence sets the highest valuation floor possible.
InvestIn’s Investor Relations Arsenal delivers a wide array of unique tools enabling you to translate your valuation target in analytical language sell-side and buy-side analysts listen to and understand.
1 - 5 Users
(No discount)
$500
/user/month
(Optional hedge fund directory is an additional $6,000)
6 - 10 Users
(15% discount)
$425
/user/month
(Hedge fund directory is included)
10+ Users
(25% discount)
$375
/user/month
(Hedge fund directory is included)